

Telemetry that shows how you lost time.
Lap times tell you a lap was slow. Insights shows why: speed, delta, g-force and engine data across the whole lap, lined up by distance.
Track RatIncluded for Track Rats, from €3.33 a month. See pricing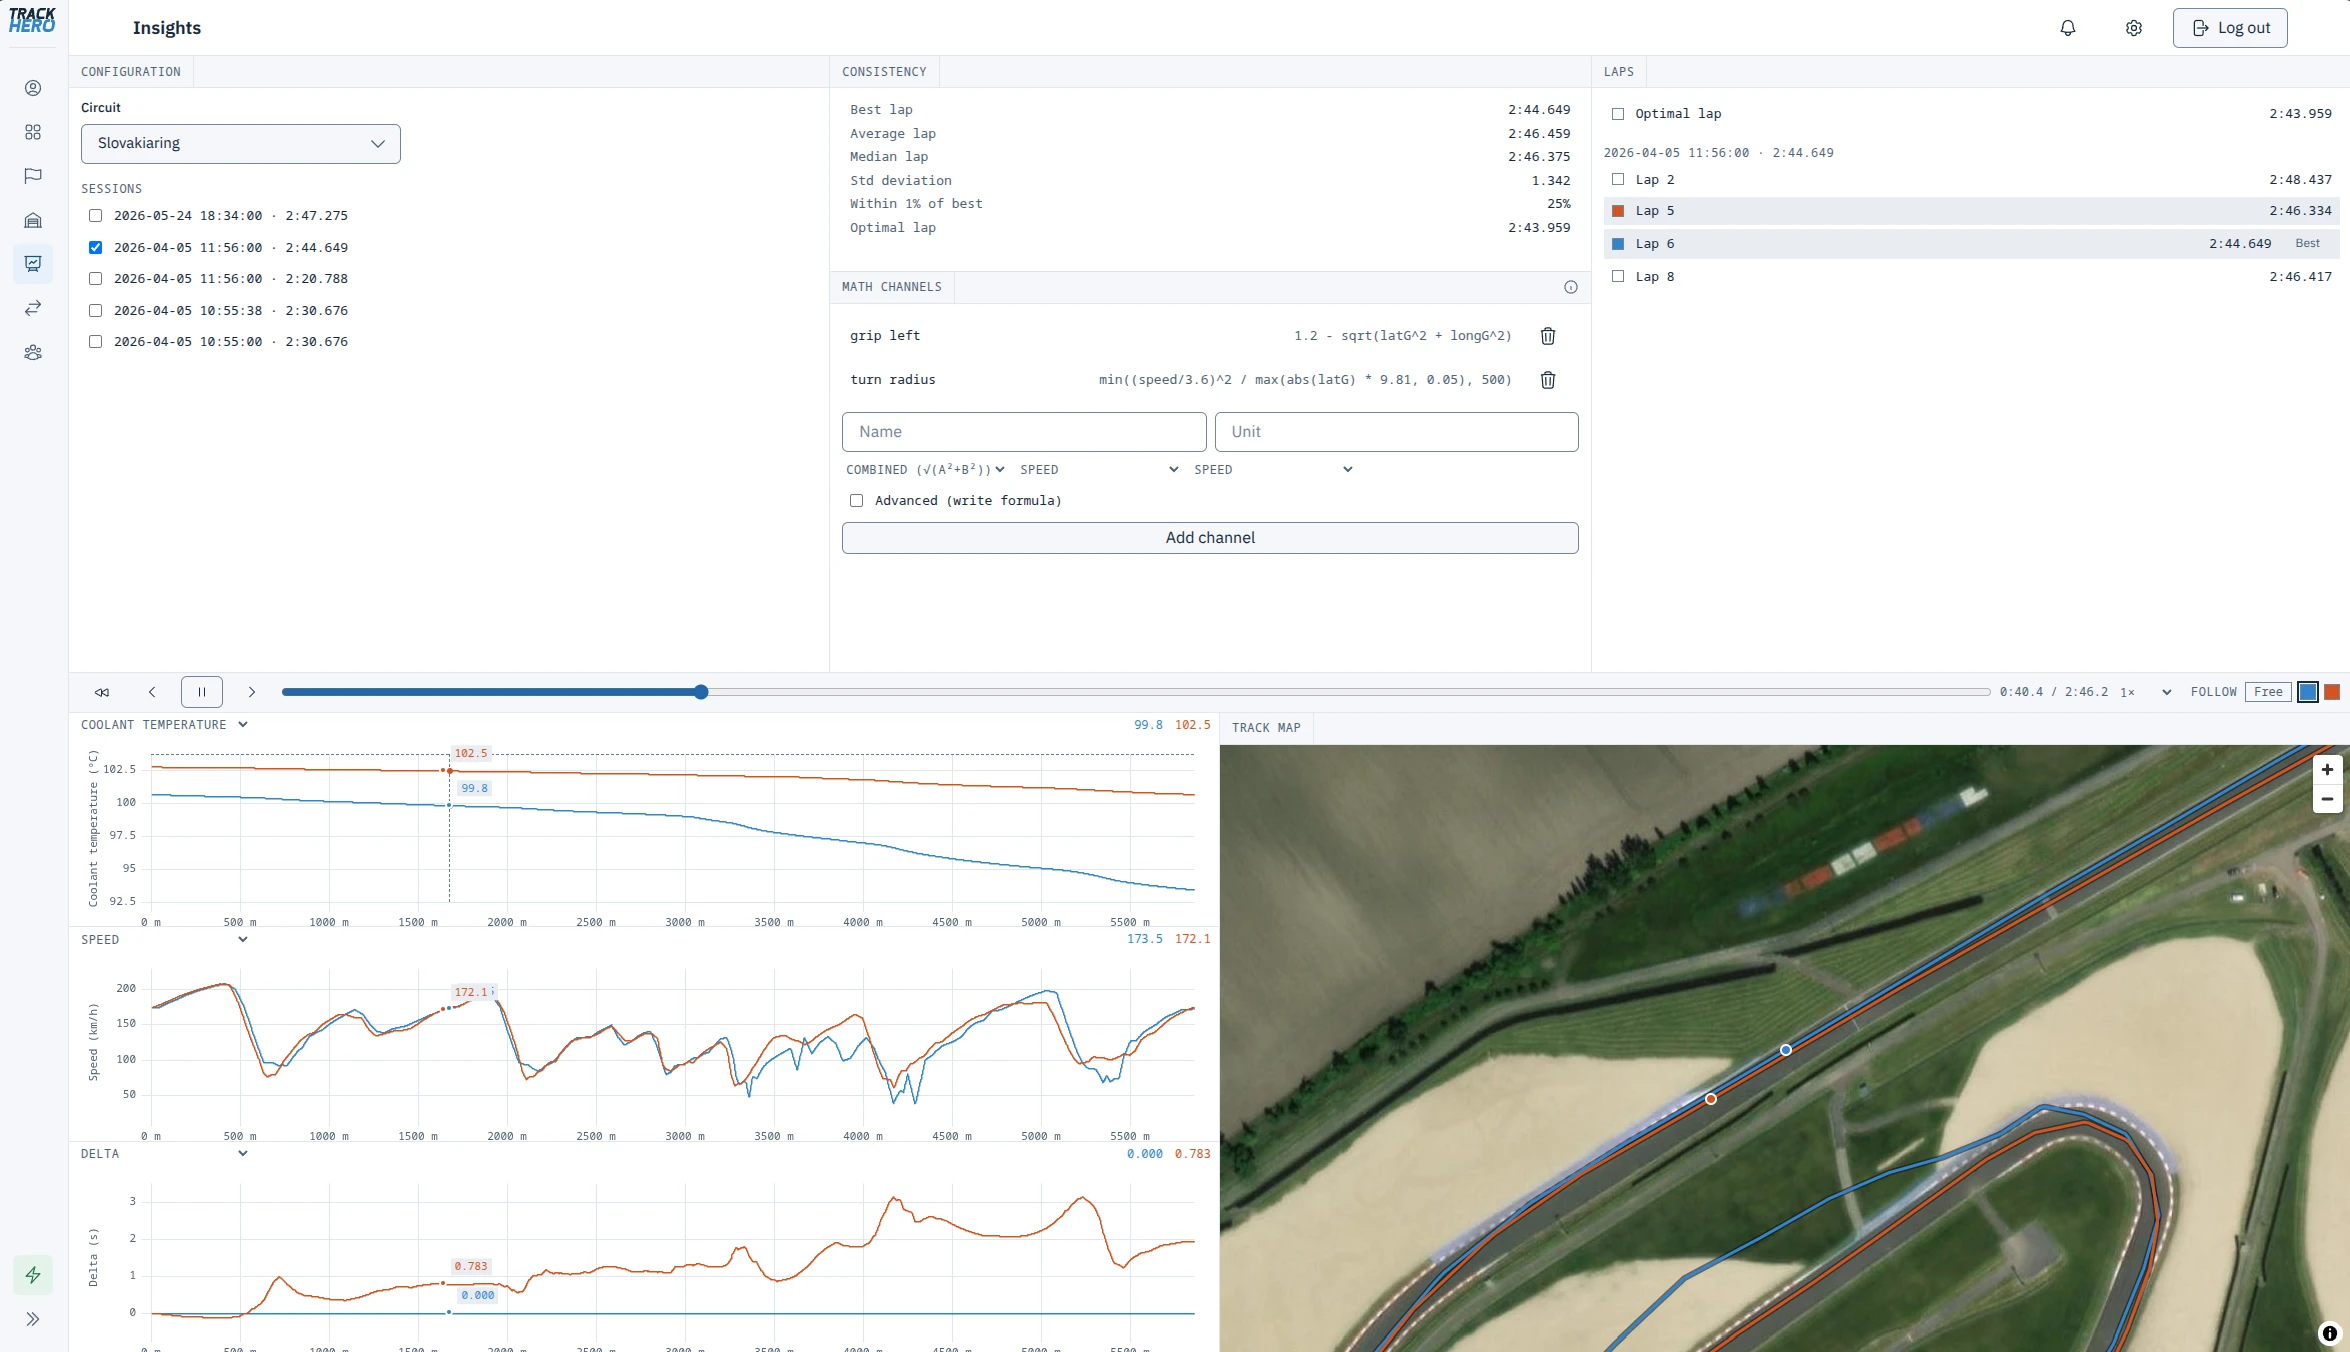
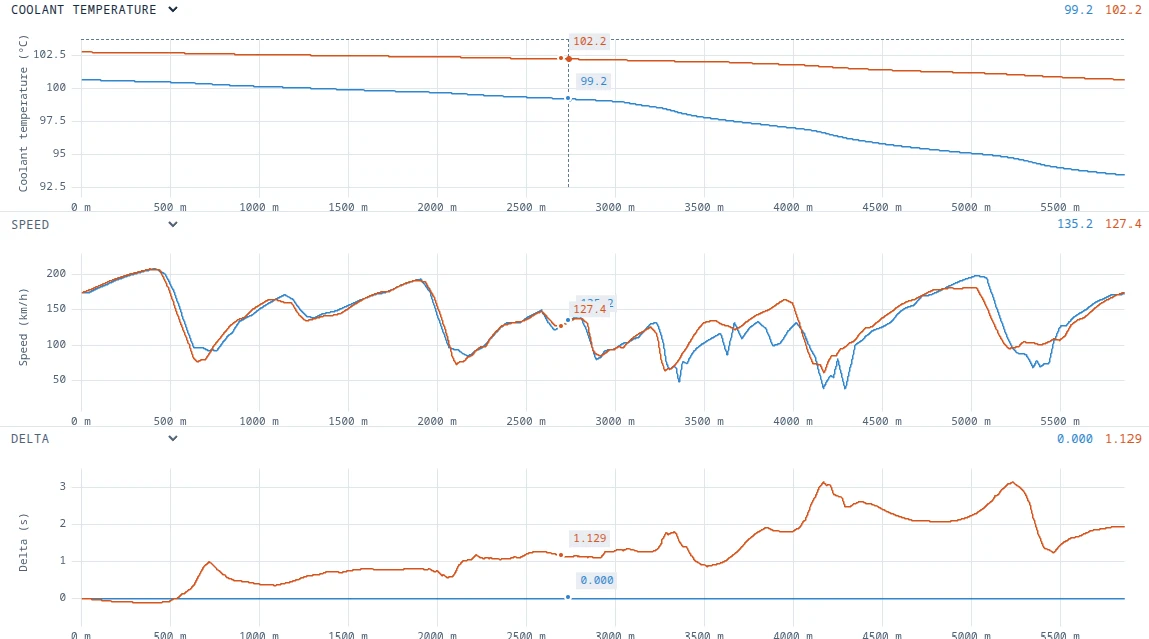
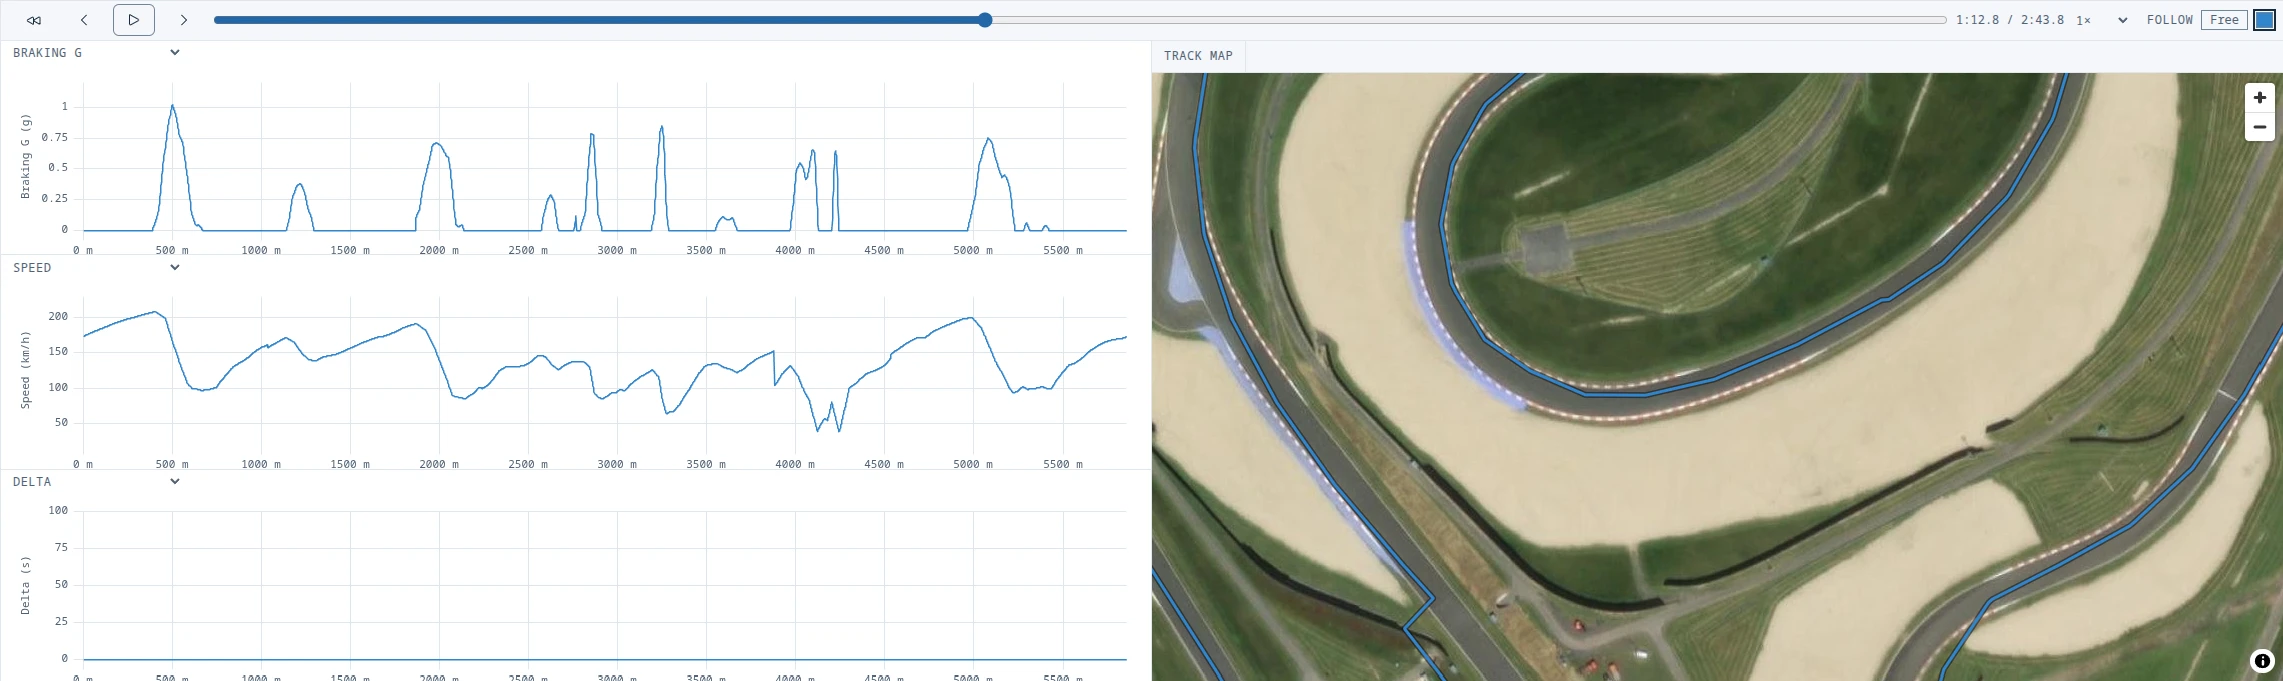
The delta chart points at the corner.
Overlay up to 8 laps. Speed traces show what the car did. The delta line below shows what it cost against your first pick: it climbs where you lose time and falls where you gain it, metre by metre. The satellite map shows the same gap on the real track.
Finding the one corner worth a whole session of practice.
You fix the cause, a late turn-in or an early lift, not the symptom.
Braking and grip, in g.
Longitudinal and lateral g show how hard you really brake and how much of the tyre you use through each corner. Gaps in the circle are grip you left on the table.
Checking if you brake as hard as the car allows.
Most time hides in braking zones. This shows exactly how much.
Engine data when your logger records it.
RPM, throttle and temperatures from OBD or CAN sit on the same distance axis as speed. See the early lift, the missed shift and the car that got hot in the third lap.
Linking what your feet did to what the lap time did.
It separates driver mistakes from car limits.
Consistency across the whole day.
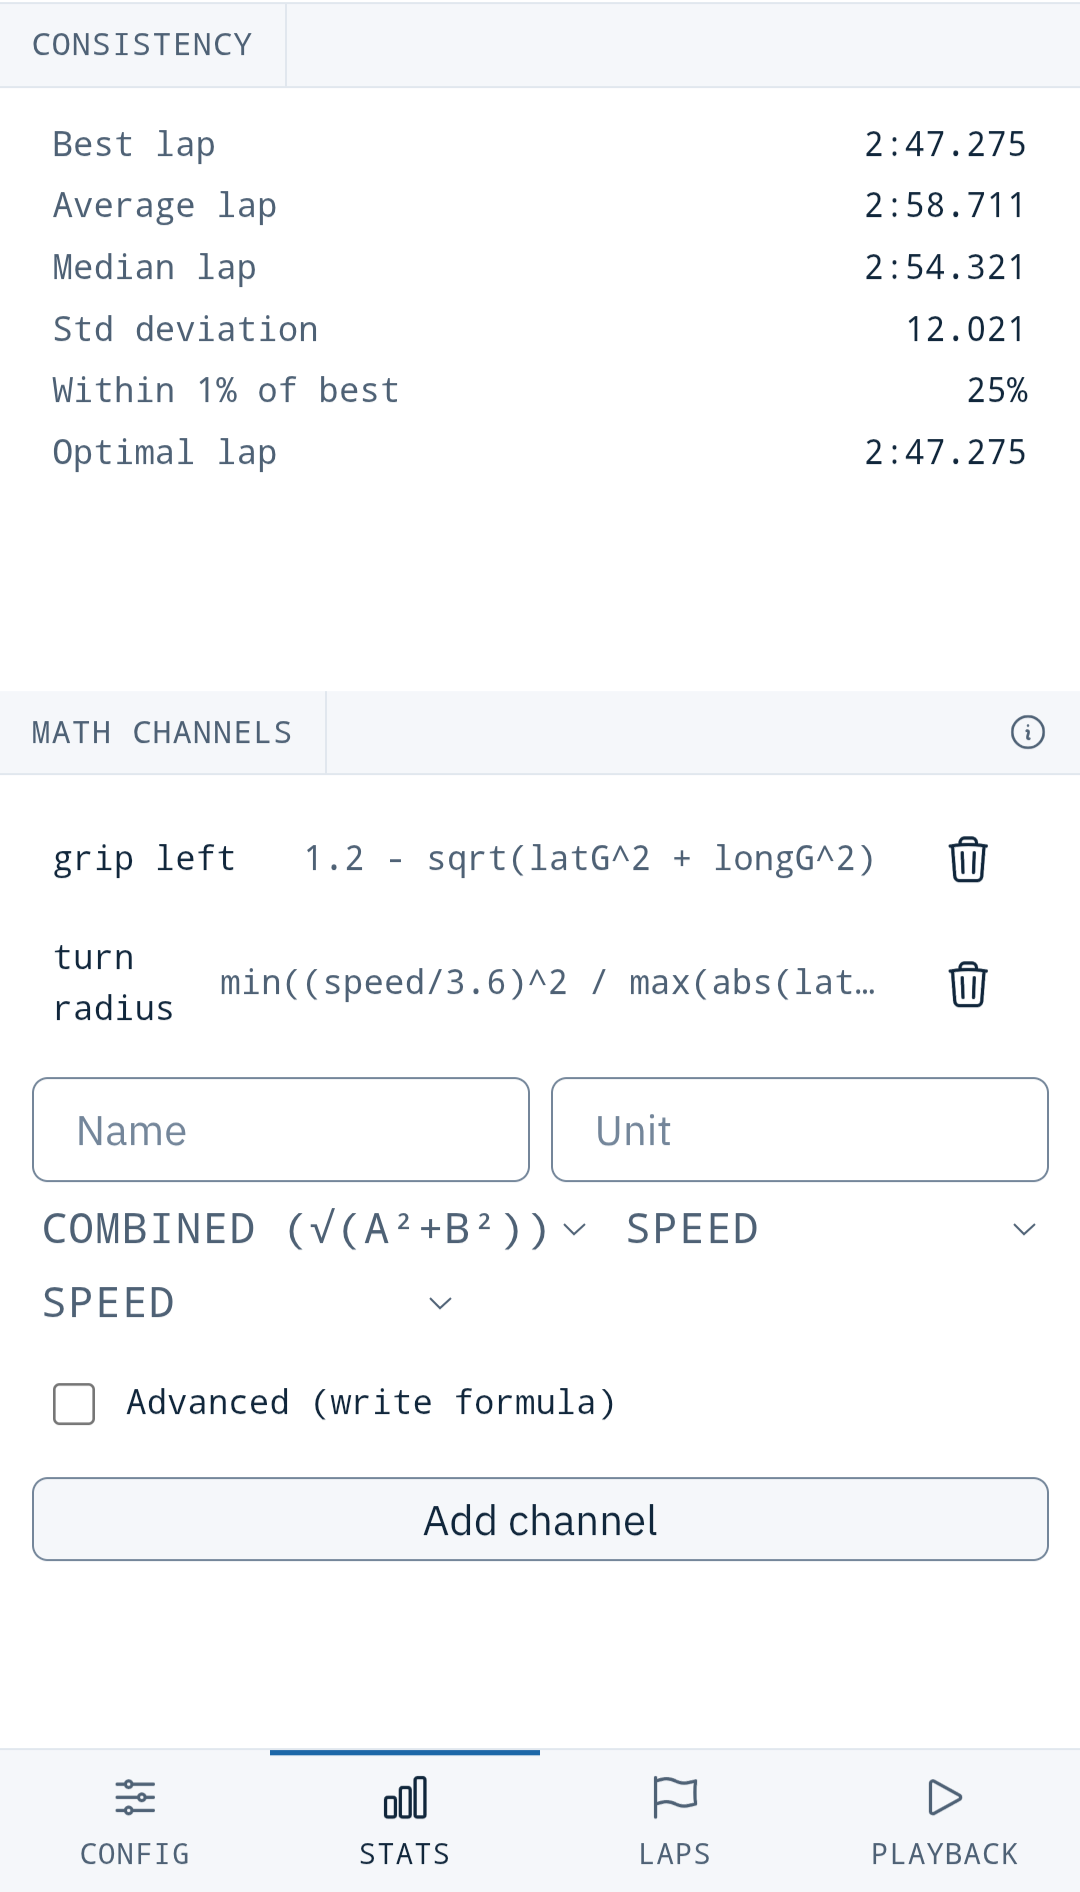
A fast lap is good. Ten laps close to it is better. See your average, median and spread across the day.
Knowing if a new setup made you faster or just luckier.
Consistency is what wins races and survives long track days.
Build your own channels.
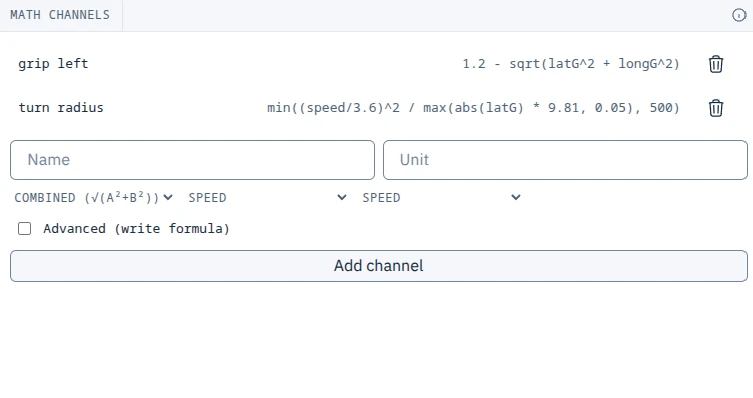
Get facts your logger never shows, like how much grip you use or how long you trail brake. Pick a ready preset such as combined G or braking G, or write a formula like sqrt(latG^2 + longG^2) from your speed, g-force and OBD channels.
Measuring how much grip you use, or how long you trail brake.
You chart the thing you care about, not only what the logger gives you.
Replay the lap, and find your optimal one.
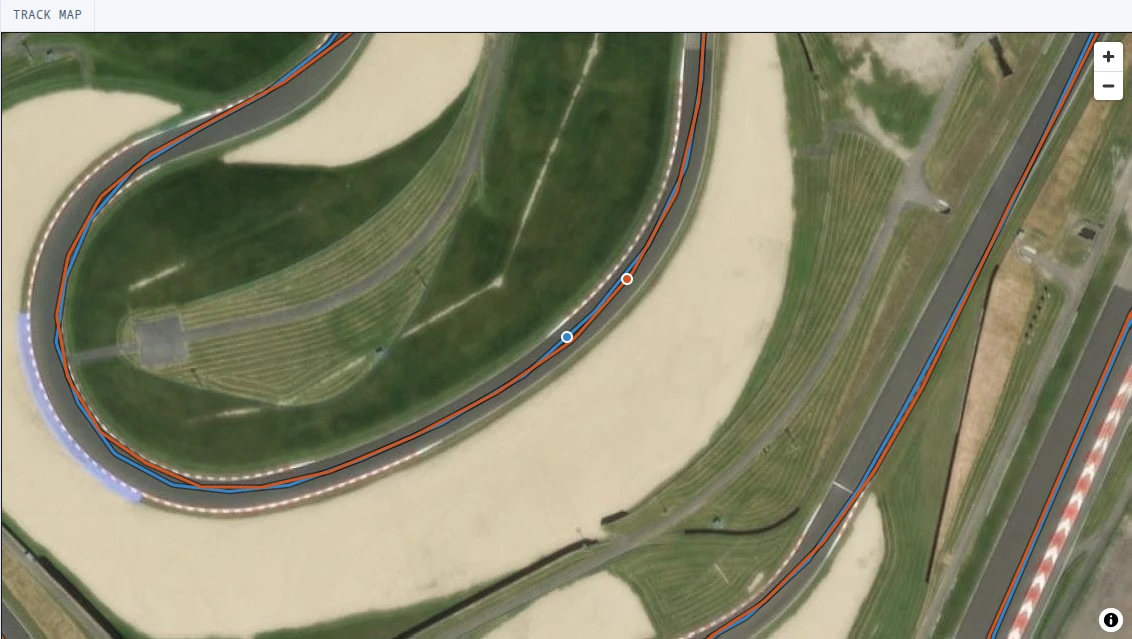
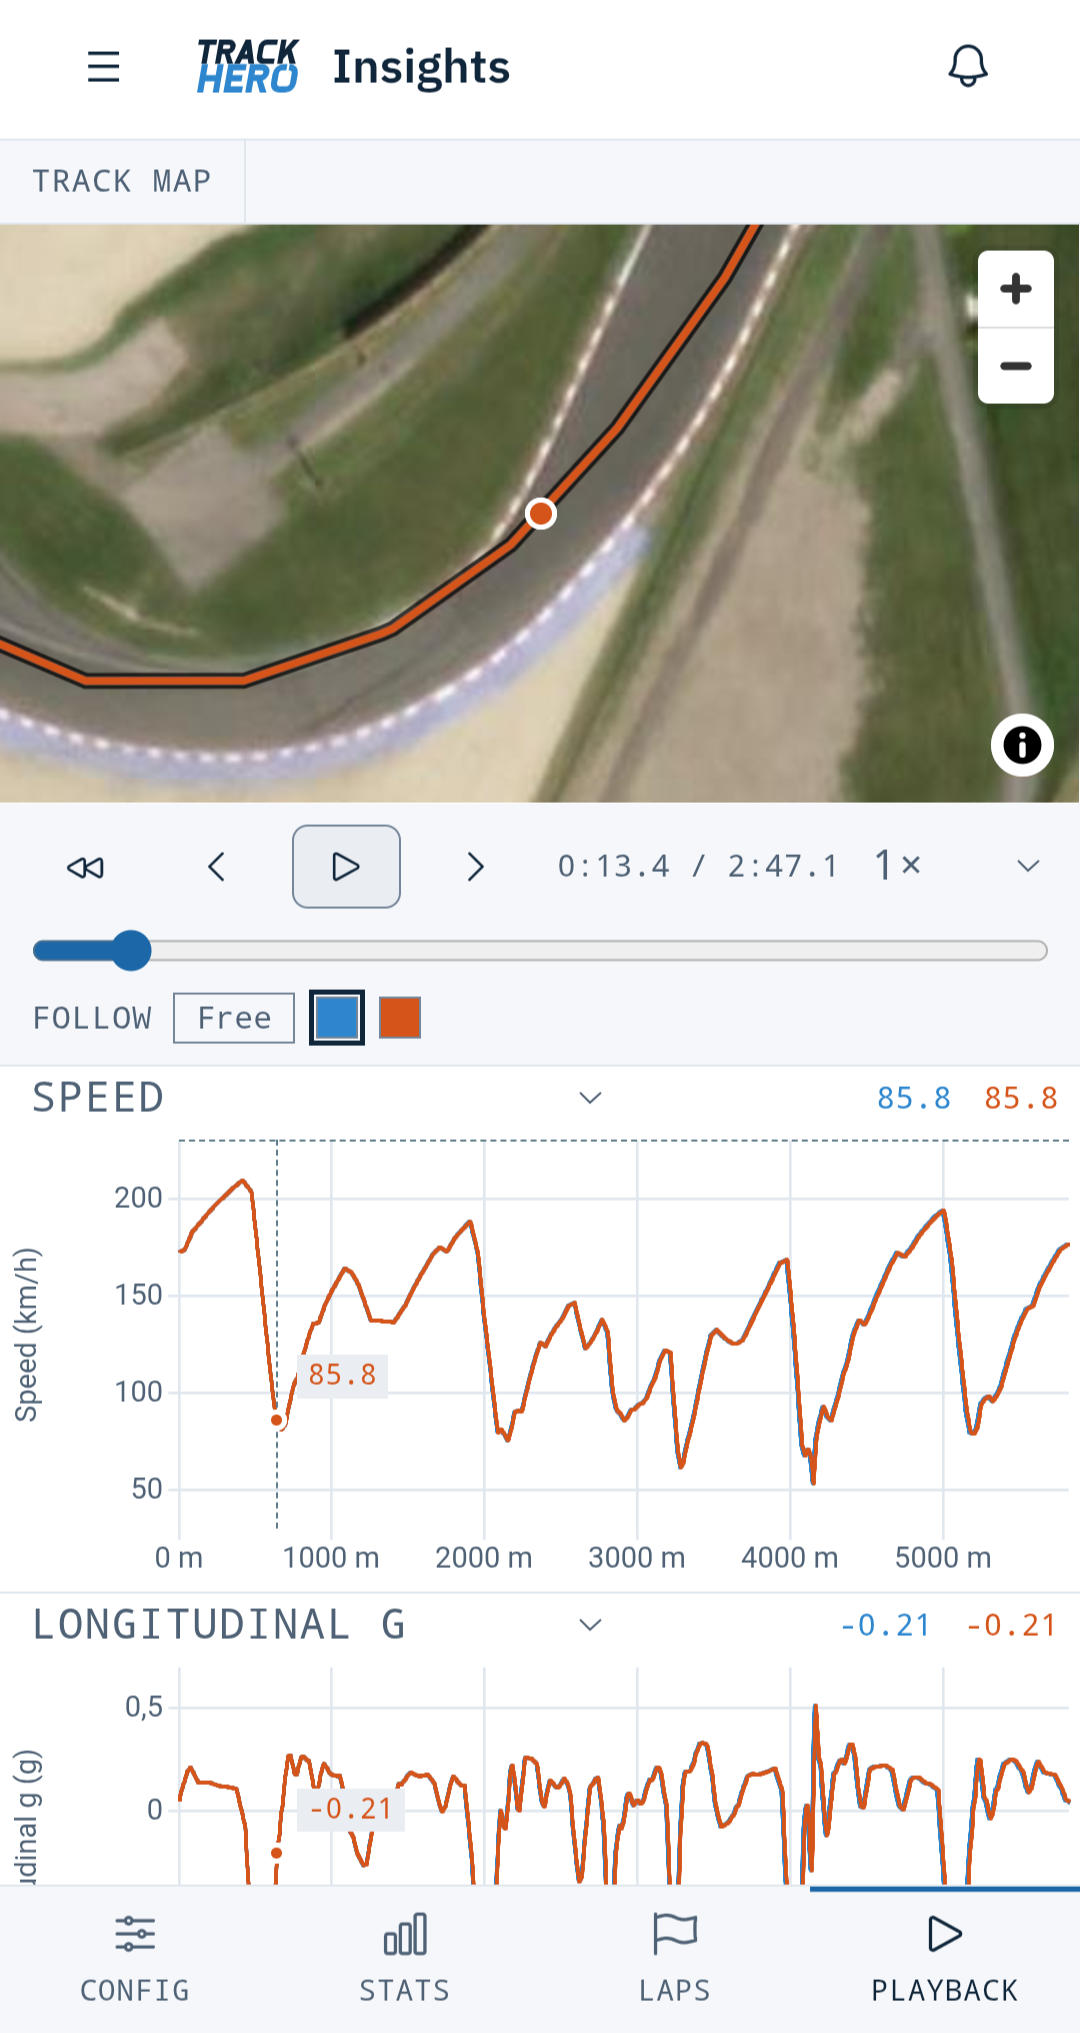
Play any lap back in real time and follow the car on the map. Add the optimal lap, stitched from your best sectors of the day, as a reference to chase.
Seeing where the car was when the delta opened up.
The optimal lap is a target built only from your own driving.
Easy to read on your phone.
Open Insights in the paddock. On a phone it switches to four views with a tab bar at the bottom: Config, Stats (consistency and math channels), Laps and Playback. Made for one hand.
Checking a lap between sessions, right next to the car.
Nothing to install and no laptop to carry.
Keep exploring
Questions drivers ask
What data does Insights need?
Any .vbo, .gpx or .csv file with GPS gives you speed, delta, g-force and the track map. RPM, throttle and temperatures appear when your logger records OBD or CAN channels and the file carries them (.vbo and .csv).
How are two laps lined up?
By distance around the track, not by time, so the same corner sits at the same point on both traces.
What do the consistency stats show?
Average and median lap, the spread between your best and worst, and how many laps were within 1% of your best.
Can I try Insights before paying?
Yes. Start a 7-day Track Rat trial from your settings. No card needed.
See it on your own laps.
Drop in your last .vbo, .gpx or .csv file. It takes a few seconds and needs no account.
One demo is worth more than 1000 words. No account needed to try, and nothing is saved until you sign up.